EV Charging Costs, 2026

Where Electrician Wages Make a Home EV Charger Cost the Most, and the Least, in 2026

A metro-by-metro estimate of home Level 2 charger installation cost, modeled from licensed-electrician wages, with a second section on the housing conditions, metro by metro, that turn a charger circuit into a panel job. 173 metros, 289 cities, one national price for the hardware.

Published: June 24, 2026Updated: August 25, 2026Wage data: BLS OEWS May 2025

The short answer

By Matt Kovalik, licensed Minnesota electrician (Journeyworker License #AJ703617). Matt works on EV charging infrastructure at Metro Transit.

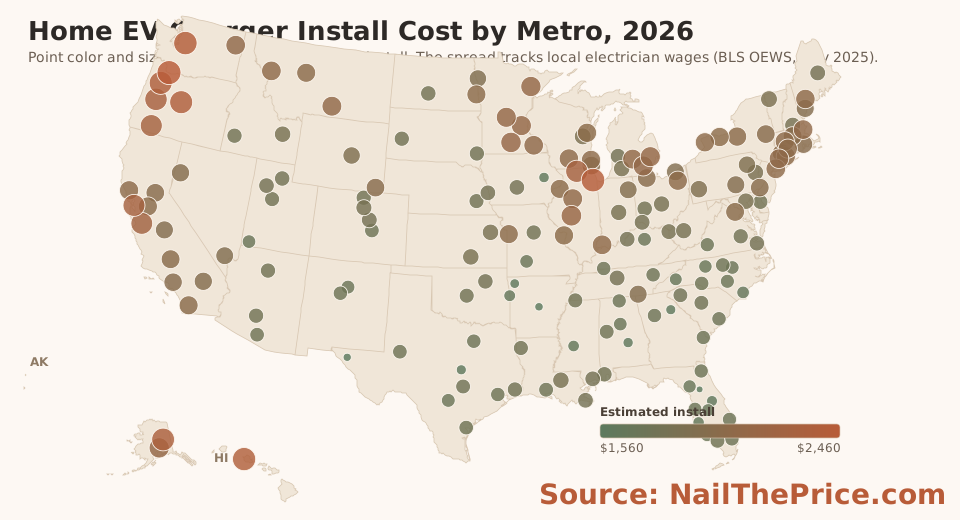
A home Level 2 EV charger installation runs about $1,800 at the national median electrician wage in 2026. Across the 173 metros in this study it ranges from roughly $1,560 in the least expensive metro (Ocala, FL) to about $2,460 in the most expensive (Portland-Vancouver-Hillsboro, OR-WA), a spread of about $900 that, in this model, comes entirely from local electrician labor, because the charger hardware and the materials are held at national prices.

We estimated every metro the same way: hold the equipment and materials at their national cost, then flex only the labor portion by the local electrician wage reported by the U.S. Bureau of Labor Statistics. Because labor is the only input that moves from place to place, the cost ranking simply follows the wage ranking, metro by metro. That is the whole story of the wage spread, and the map, the ranked chart, and the full table below show it. A second section then covers the other half of a real quote: whether the house's electrical service can take the charger.

$1,800
Install at the national median electrician wage
$1,560
Least expensive metro (Ocala)
$2,460
Most expensive metro (Portland-Vancouver-Hillsboro)
1.58x
Top to bottom ratio, labor only

The federal home charger tax credit expired on June 30, 2026

The federal tax credit that offsets part of a home EV charger installation expired on June 30, 2026. A home charger installed now gets no federal credit, so the dollar figures on this page are full retail estimates with no incentive subtracted.1

1. The credit was the federal Alternative Fuel Vehicle Refueling Property Credit (Internal Revenue Code Section 30C), which covered 30 percent of a residential charger installation up to $1,000 and expired June 30, 2026. Some states and electric utilities still run their own EV charger rebates, so check local programs before you budget.

The national number

The $1,800 headline is the estimated install at the national median electrician wage, which is $30.38 per hour for electricians in the May 2025 BLS data. It is the right single number to anchor on. For reference, the simple average across the 289 cities in this study works out to about $1,920, which sits above the $1,800 figure only because the studied cities skew toward higher-wage metros. That $1,920 is a study average, not a national average, and it should not be read as one.

Take Minneapolis as a worked example. The metro electrician median is $39.37 per hour, about 30 percent above the national median, so the estimate comes to about $2,090. That places Minneapolis 40th of the 289 cities in this study, which is 18th of the 173 ranked metros once cities in the same metro are combined.

Why two EV charger quotes can look so different

A Level 2 charger does not cost more in Portland because the charger is different from the one installed in Florida. The hardware is basically the same everywhere. The wire, breaker, conduit, fittings, and the charger unit are priced nationally. What changes from city to city is the licensed electrician labor it takes to install them, which is exactly what this study isolates.

That is also why a real quote can land far from the baseline. A charger mounted next to an existing panel with open capacity is a simple job. A long wire run across a finished basement, a detached garage, or a service panel that cannot accept another 240V continuous load, or one in poor enough condition that it should not be added to, is a different job, and the price reflects it. None of that is geography. It is the condition of your electrical system once the panel is opened.

This study does not try to price every panel upgrade or awkward garage layout, because those depend on the house, not the city. It holds the equipment and materials at their national cost and flexes only the labor, so the number you see is the local wage baseline before any house-specific work is added. Treat it as the floor to compare against, then expect a long run, or panel or service work when the load calculation or the panel's condition calls for it, to push a real quote higher. The section on service jobs further down explains which is which.

The map: install cost by metro

Each point is one metro at its Census centroid, colored and sized by the estimated Level 2 install. Sage is lower cost, terracotta is higher. With JavaScript on, the map is interactive; with it off, the same map renders below and every value is in the table further down.

Home EV Charger Install Cost by Metro, 2026Point color and size show the estimated Level 2 install. The spread tracks local electrician wages (BLS OEWS, May 2025).AKHIEstimated install$1,560$2,460Source: NailThePrice.com
Embed this map (static SVG) Download the full cost data (CSV)

The 15 most and 15 least expensive metros

Estimated Level 2 install, ranked. Every bar is labeled with its dollar value. This chart is plain SVG and needs no JavaScript.

The 15 most expensive metros1. Portland-Vancouver-Hillsboro, OR-WA$2,4572. Chicago-Naperville-Elgin, IL-IN$2,4143. Seattle-Tacoma-Bellevue, WA$2,4044. Urban Honolulu, HI$2,3815. Bend, OR$2,3646. Salem, OR$2,3597. Fairbanks-College, AK$2,3438. Eugene-Springfield, OR$2,2939. Rockford, IL$2,27210. San Francisco-Oakland-Fremont, CA$2,26411. Medford, OR$2,25812. San Jose-Sunnyvale-Santa Clara, CA$2,23613. Springfield, IL$2,13814. Mankato, MN$2,11215. Duluth, MN-WI$2,106The 15 least expensive metros159. Lakeland-Winter Haven, FL$1,670160. Asheville, NC$1,665161. Wilmington, NC$1,657162. Fort Smith, AR-OK$1,632163. Jackson, MS$1,630164. North Port-Bradenton-Sarasota, FL$1,624165. Orlando-Kissimmee-Sanford, FL$1,606166. Cedar Rapids, IA$1,597167. Montgomery, AL$1,592168. Athens-Clarke County, GA$1,589169. Killeen-Temple, TX$1,588170. Fayetteville-Springdale-Rogers, .$1,581171. Little Rock-North Little Rock-Co.$1,565172. El Paso, TX$1,564173. Ocala, FL$1,557Source: NailThePrice.com

Full metro ranking, all 173 metros

Rank is out of 173 metros, by estimated install cost. Electrician wage is the metro hourly median for SOC 47-2111 in the BLS OEWS May 2025 data. The three highlighted metros have a documented local electrical permit fee, shown as a separate add-on.

RankMetroStateElectrician median wageEst. install
1Portland-Vancouver-Hillsboro, OR-WAOR$50.53$2,457
2Chicago-Naperville-Elgin, IL-INIL$49.21$2,414
3Seattle-Tacoma-Bellevue, WAWA$48.93$2,404
4Urban Honolulu, HIHI$48.21$2,381
5Bend, OROR$47.69$2,364
6Salem, OROR$47.53$2,359
7Fairbanks-College, AKAK$47.05$2,343
8Eugene-Springfield, OROR$45.52$2,293
9Rockford, ILIL$44.85$2,272
10San Francisco-Oakland-Fremont, CACA$44.63$2,264
11Medford, OROR$44.43$2,258
12San Jose-Sunnyvale-Santa Clara, CACA$43.77$2,236
13Springfield, ILIL$40.76$2,138
14Mankato, MNMN$39.96$2,112
15Duluth, MN-WIMN$39.76$2,106
16Anchorage, AKAK$39.63$2,101
17Detroit-Warren-Dearborn, MIMI$39.42$2,095
18Minneapolis-St. Paul-Bloomington, MN-WI (permit $35 to $300 extra)MN$39.37$2,093
19St. Cloud, MNMN$39.37$2,093
20Ann Arbor, MIMI$39.16$2,086
21Billings, MTMT$38.93$2,079
22Lansing-East Lansing, MIMI$38.69$2,071
23Peoria, ILIL$38.68$2,070
24Boston-Cambridge-Newton, MA-NHMA$38.42$2,062
25Spokane-Spokane Valley, WAWA$38.38$2,061
26Rochester, MNMN$38.29$2,058
27Bridgeport-Stamford-Danbury, CTCT$38.25$2,056
28Evansville, ININ$38.10$2,052
29Missoula, MTMT$38.10$2,052
30New York-Newark-Jersey City, NY-NJNY$37.99$2,048
31Lewiston-Auburn, MEME$37.71$2,039
32Madison, WIWI$37.71$2,039
33Buffalo-Cheektowaga, NYNY$37.47$2,031
34Milwaukee-Waukesha, WIWI$37.41$2,029
35Hartford-West Hartford-East Hartford, CTCT$37.34$2,027
36New Haven, CTCT$37.22$2,023
37Springfield, MAMA$37.22$2,023
38Santa Rosa-Petaluma, CACA$37.20$2,022
39Akron, OHOH$37.19$2,022
40Rochester, NYNY$37.17$2,021
41Green Bay, WIWI$37.15$2,021
42St. Louis, MO-ILMO$37.10$2,019
43Syracuse, NYNY$37.07$2,018
44Great Falls, MTMT$37.00$2,016
45Davenport-Moline-Rock Island, IA-ILIA$36.99$2,015
46Fargo, ND-MNND$36.99$2,015
47Kansas City, MO-KSMO$36.95$2,014
48Stockton-Lodi, CACA$36.74$2,007
49San Diego-Chula Vista-Carlsbad, CACA$36.62$2,003
50Washington-Arlington-Alexandria, DC-VA-MD-WVDC$36.50$1,999
51Bakersfield-Delano, CACA$36.47$1,998
52Waterbury-Shelton, CTCT$36.47$1,998
53Worcester, MAMA$36.30$1,993
54Kenosha, WIWI$36.04$1,984
55Albany-Schenectady-Troy, NYNY$36.01$1,983
56Sacramento-Roseville-Folsom, CACA$35.98$1,982
57Toledo, OHOH$35.92$1,981
58Cheyenne, WYWY$35.86$1,979
59Philadelphia-Camden-Wilmington, PA-NJ-DE-MDPA$35.86$1,979
60Providence-Warwick, RI-MARI$35.57$1,969
61Los Angeles-Long Beach-Anaheim, CACA$35.49$1,967
62Reno, NVNV$35.00$1,951
63Riverside-San Bernardino-Ontario, CACA$35.00$1,951
64Chattanooga, TN-GATN$34.77$1,943
65Harrisburg-Carlisle, PAPA$34.53$1,935
66Fresno, CACA$34.48$1,934
67Portland-South Portland, MEME$34.45$1,933
68Fort Wayne, ININ$34.27$1,927
69Las Vegas-Henderson-North Las Vegas, NVNV$34.08$1,921
70Cleveland, OHOH$34.07$1,920
71Grand Forks, ND-MNND$33.51$1,902
72Casper, WYWY$33.48$1,901
73Scranton--Wilkes-Barre, PAPA$33.44$1,900
74Pittsburgh, PAPA$33.34$1,896
75Burlington-South Burlington, VTVT$32.14$1,857
76Appleton, WIWI$32.13$1,857
77Allentown-Bethlehem-Easton, PA-NJPA$31.97$1,852
78Kalamazoo-Portage, MIMI$31.58$1,839
79Wichita, KSKS$31.57$1,839
80Baltimore-Columbia-Towson, MDMD$31.54$1,838
81Topeka, KSKS$31.50$1,836
82Idaho Falls, IDID$31.42$1,834
83Baton Rouge, LALA$31.41$1,834
84Indianapolis-Carmel-Greenwood, ININ$31.31$1,830
85Charleston, WVWV$31.17$1,826
86Columbus, OHOH$31.11$1,824
87Boulder, COCO$30.83$1,815
88Manchester-Nashua, NHNH$30.81$1,814
89Huntington-Ashland, WV-KY-OHWV$30.59$1,807
90Cincinnati, OH-KY-INOH$30.53$1,805
91Bangor, MEME$30.48$1,803
92Nashville-Davidson--Murfreesboro--Franklin, TNTN$30.45$1,802
93Denver-Aurora-Centennial, COCO$30.36$1,799
94Des Moines-West Des Moines, IAIA$30.21$1,794
95Salt Lake City-Murray, UTUT$30.11$1,791
96New Orleans-Metairie, LALA$30.04$1,789
97Gulfport-Biloxi, MSMS$30.02$1,788
98Louisville/Jefferson County, KY-INKY$30.02$1,788
99Omaha, NE-IANE$30.02$1,788
100Virginia Beach-Chesapeake-Norfolk, VA-NCVA$29.98$1,787
101Tulsa, OKOK$29.94$1,786
102Grand Rapids-Wyoming-Kentwood, MIMI$29.92$1,785
103Ogden, UTUT$29.82$1,782
104Bismarck, NDND$29.76$1,780
105Dayton-Kettering-Beavercreek, OHOH$29.75$1,779
106Mobile, ALAL$29.68$1,777
107Boise City, IDID$29.62$1,775
108Columbia, MOMO$29.57$1,774
109Sioux Falls, SD-MNSD$29.55$1,773
110Fort Collins-Loveland, COCO$29.52$1,772
111Beaumont-Port Arthur, TXTX$29.51$1,772
112Richmond, VAVA$29.50$1,771
113Flagstaff, AZAZ$29.49$1,771
114Phoenix-Mesa-Chandler, AZ (permit $195 to $500 extra)AZ$29.43$1,769
115Rapid City, SDSD$29.40$1,768
116Oklahoma City, OKOK$29.33$1,766
117Memphis, TN-MS-ARTN$29.27$1,764
118Provo-Orem-Lehi, UTUT$29.26$1,764
119Shreveport-Bossier City, LALA$29.25$1,763
120Dover, DEDE$29.21$1,762
121Lincoln, NENE$29.17$1,761
122Austin-Round Rock-San Marcos, TXTX$29.03$1,756
123Columbia, SCSC$29.03$1,756
124Greenville-Anderson-Greer, SCSC$28.95$1,753
125Tuscaloosa, ALAL$28.90$1,752
126Naples-Marco Island, FLFL$28.86$1,750
127Lafayette, LALA$28.76$1,747
128Midland, TXTX$28.62$1,743
129Tucson, AZAZ$28.60$1,742
130Corpus Christi, TXTX$28.56$1,741
131Colorado Springs, COCO$28.47$1,738
132Durham-Chapel Hill, NCNC$28.47$1,738
133Houston-Pasadena-The Woodlands, TXTX$28.45$1,737
134Albuquerque, NMNM$28.43$1,736
135Charlotte-Concord-Gastonia, NC-SCNC$28.41$1,736
136Charleston-North Charleston, SCSC$28.37$1,734
137Dallas-Fort Worth-Arlington, TXTX$28.37$1,734
138Clarksville, TN-KYTN$28.21$1,729
139Atlanta-Sandy Springs-Roswell, GA (permit $175 to $500 extra)GA$28.20$1,729
140Knoxville, TNTN$28.19$1,729
141Miami-Fort Lauderdale-West Palm Beach, FLFL$28.19$1,729
142Port St. Lucie, FLFL$28.14$1,727
143Huntsville, ALAL$28.13$1,727
144Savannah, GAGA$28.09$1,725
145Jacksonville, FLFL$28.02$1,723
146Roanoke, VAVA$27.98$1,722
147Cape Coral-Fort Myers, FLFL$27.85$1,718
148Fayetteville, NCNC$27.74$1,714
149Tampa-St. Petersburg-Clearwater, FLFL$27.62$1,710
150Lexington-Fayette, KYKY$27.56$1,708
151Santa Fe, NMNM$27.52$1,707
152San Antonio-New Braunfels, TXTX$27.41$1,703
153Raleigh-Cary, NCNC$27.31$1,700
154Birmingham, ALAL$27.23$1,697
155Springfield, MOMO$27.21$1,697
156St. George, UTUT$27.17$1,695
157Winston-Salem, NCNC$26.97$1,689
158Gainesville, FLFL$26.77$1,682
159Lakeland-Winter Haven, FLFL$26.40$1,670
160Asheville, NCNC$26.25$1,665
161Wilmington, NCNC$26.00$1,657
162Fort Smith, AR-OKAR$25.24$1,632
163Jackson, MSMS$25.15$1,630
164North Port-Bradenton-Sarasota, FLFL$24.97$1,624
165Orlando-Kissimmee-Sanford, FLFL$24.43$1,606
166Cedar Rapids, IAIA$24.15$1,597
167Montgomery, ALAL$23.99$1,592
168Athens-Clarke County, GAGA$23.92$1,589
169Killeen-Temple, TXTX$23.88$1,588
170Fayetteville-Springdale-Rogers, ARAR$23.67$1,581
171Little Rock-North Little Rock-Conway, ARAR$23.17$1,565
172El Paso, TXTX$23.14$1,564
173Ocala, FLFL$22.93$1,557

Find your city

All 289 cities in the study, alphabetical, each mapped to its metro and estimated install. This list is server-rendered and needs no JavaScript. After the list, the page turns from what the labor costs to what the house may need.

Akron, OH $2,022
Akron metro
Albany, NY $1,983
Albany-Schenectady-Troy metro
Albuquerque, NM $1,736
Albuquerque metro
Alexandria, VA $1,999
Washington-Arlington-Alexandria metro
Allentown, PA $1,852
Allentown-Bethlehem-Easton metro
Alpharetta, GA $1,729
Atlanta-Sandy Springs-Roswell metro
Anaheim, CA $1,967
Los Angeles-Long Beach-Anaheim metro
Anchorage, AK $2,101
Anchorage metro
Ann Arbor, MI $2,086
Ann Arbor metro
Appleton, WI $1,857
Appleton metro
Arlington, VA $1,999
Washington-Arlington-Alexandria metro
Arlington, TX $1,734
Dallas-Fort Worth-Arlington metro
Asheville, NC $1,665
Asheville metro
Athens, GA $1,589
Athens-Clarke County metro
Atlanta, GA $1,729
Atlanta-Sandy Springs-Roswell metro
Aurora, IL $2,414
Chicago-Naperville-Elgin metro
Aurora, CO $1,799
Denver-Aurora-Centennial metro
Austin, TX $1,756
Austin-Round Rock-San Marcos metro
Bakersfield, CA $1,998
Bakersfield-Delano metro
Baltimore, MD $1,838
Baltimore-Columbia-Towson metro
Bangor, ME $1,803
Bangor metro
Baton Rouge, LA $1,834
Baton Rouge metro
Beaumont, TX $1,772
Beaumont-Port Arthur metro
Beaverton, OR $2,457
Portland-Vancouver-Hillsboro metro
Bellevue, WA $2,404
Seattle-Tacoma-Bellevue metro
Bend, OR $2,364
Bend metro
Bethesda, MD $1,999
Washington-Arlington-Alexandria metro
Billings, MT $2,079
Billings metro
Birmingham, AL $1,697
Birmingham metro
Bismarck, ND $1,780
Bismarck metro
Blaine, MN $2,093
Minneapolis-St. Paul-Bloomington metro
Bloomington, MN $2,093
Minneapolis-St. Paul-Bloomington metro
Boise, ID $1,775
Boise City metro
Boston, MA $2,062
Boston-Cambridge-Newton metro
Boulder, CO $1,815
Boulder metro
Broken Arrow, OK $1,786
Tulsa metro
Buffalo, NY $2,031
Buffalo-Cheektowaga metro
Burlington, VT $1,857
Burlington-South Burlington metro
Cambridge, MA $2,062
Boston-Cambridge-Newton metro
Cape Coral, FL $1,718
Cape Coral-Fort Myers metro
Carmel, IN $1,830
Indianapolis-Carmel-Greenwood metro
Cary, NC $1,700
Raleigh-Cary metro
Casper, WY $1,901
Casper metro
Cedar Rapids, IA $1,597
Cedar Rapids metro
Centennial, CO $1,799
Denver-Aurora-Centennial metro
Chandler, AZ $1,769
Phoenix-Mesa-Chandler metro
Charleston, WV $1,826
Charleston metro
Charleston, SC $1,734
Charleston-North Charleston metro
Charlotte, NC $1,736
Charlotte-Concord-Gastonia metro
Chaska, MN $2,093
Minneapolis-St. Paul-Bloomington metro
Chattanooga, TN $1,943
Chattanooga metro
Chesapeake, VA $1,787
Virginia Beach-Chesapeake-Norfolk metro
Cheyenne, WY $1,979
Cheyenne metro
Chicago, IL $2,414
Chicago-Naperville-Elgin metro
Cincinnati, OH $1,805
Cincinnati metro
Clarksville, TN $1,729
Clarksville metro
Cleveland, OH $1,920
Cleveland metro
Colorado Springs, CO $1,738
Colorado Springs metro
Columbia, MD $1,838
Baltimore-Columbia-Towson metro
Columbia, MO $1,774
Columbia metro
Columbia, SC $1,756
Columbia metro
Columbus, OH $1,824
Columbus metro
Concord, NH $1,748
state nonmetro wage, see note2
Coon Rapids, MN $2,093
Minneapolis-St. Paul-Bloomington metro
Coral Springs, FL $1,729
Miami-Fort Lauderdale-West Palm Beach metro
Corpus Christi, TX $1,741
Corpus Christi metro
Cranston, RI $1,969
Providence-Warwick metro
Dallas, TX $1,734
Dallas-Fort Worth-Arlington metro
Davenport, IA $2,015
Davenport-Moline-Rock Island metro
Dayton, OH $1,779
Dayton-Kettering-Beavercreek metro
Denton, TX $1,734
Dallas-Fort Worth-Arlington metro
Denver, CO $1,799
Denver-Aurora-Centennial metro
Des Moines, IA $1,794
Des Moines-West Des Moines metro
Detroit, MI $2,095
Detroit-Warren-Dearborn metro
Dover, DE $1,762
Dover metro
Duluth, MN $2,106
Duluth metro
Durham, NC $1,738
Durham-Chapel Hill metro
Eagan, MN $2,093
Minneapolis-St. Paul-Bloomington metro
Eden Prairie, MN $2,093
Minneapolis-St. Paul-Bloomington metro
Edina, MN $2,093
Minneapolis-St. Paul-Bloomington metro
Edison, NJ $2,048
New York-Newark-Jersey City metro
El Paso, TX $1,564
El Paso metro
Elk Grove, CA $1,982
Sacramento-Roseville-Folsom metro
Eugene, OR $2,293
Eugene-Springfield metro
Evanston, IL $2,414
Chicago-Naperville-Elgin metro
Evansville, IN $2,052
Evansville metro
Fairbanks, AK $2,343
Fairbanks-College metro
Fargo, ND $2,015
Fargo metro
Fayetteville, NC $1,714
Fayetteville metro
Fayetteville, AR $1,581
Fayetteville-Springdale-Rogers metro
Federal Way, WA $2,404
Seattle-Tacoma-Bellevue metro
Fishers, IN $1,830
Indianapolis-Carmel-Greenwood metro
Flagstaff, AZ $1,771
Flagstaff metro
Fort Collins, CO $1,772
Fort Collins-Loveland metro
Fort Lauderdale, FL $1,729
Miami-Fort Lauderdale-West Palm Beach metro
Fort Smith, AR $1,632
Fort Smith metro
Fort Wayne, IN $1,927
Fort Wayne metro
Fort Worth, TX $1,734
Dallas-Fort Worth-Arlington metro
Frederick, MD $1,999
Washington-Arlington-Alexandria metro
Fremont, CA $2,264
San Francisco-Oakland-Fremont metro
Fresno, CA $1,934
Fresno metro
Frisco, TX $1,734
Dallas-Fort Worth-Arlington metro
Gainesville, FL $1,682
Gainesville metro
Gilbert, AZ $1,769
Phoenix-Mesa-Chandler metro
Goodyear, AZ $1,769
Phoenix-Mesa-Chandler metro
Grand Forks, ND $1,902
Grand Forks metro
Grand Rapids, MI $1,785
Grand Rapids-Wyoming-Kentwood metro
Great Falls, MT $2,016
Great Falls metro
Green Bay, WI $2,021
Green Bay metro
Greenville, SC $1,753
Greenville-Anderson-Greer metro
Gulfport, MS $1,788
Gulfport-Biloxi metro
Harrisburg, PA $1,935
Harrisburg-Carlisle metro
Hartford, CT $2,027
Hartford-West Hartford-East Hartford metro
Henderson, NV $1,921
Las Vegas-Henderson-North Las Vegas metro
Hillsboro, OR $2,457
Portland-Vancouver-Hillsboro metro
Honolulu, HI $2,381
Urban Honolulu metro
Houston, TX $1,737
Houston-Pasadena-The Woodlands metro
Huntington, WV $1,807
Huntington-Ashland metro
Huntsville, AL $1,727
Huntsville metro
Idaho Falls, ID $1,834
Idaho Falls metro
Indianapolis, IN $1,830
Indianapolis-Carmel-Greenwood metro
Irvine, CA $1,967
Los Angeles-Long Beach-Anaheim metro
Jackson, MS $1,630
Jackson metro
Jacksonville, FL $1,723
Jacksonville metro
Jersey City, NJ $2,048
New York-Newark-Jersey City metro
Johns Creek, GA $1,729
Atlanta-Sandy Springs-Roswell metro
Joliet, IL $2,414
Chicago-Naperville-Elgin metro
Juneau, AK $2,252
state nonmetro wage, see note2
Kailua, HI $2,381
Urban Honolulu metro
Kalamazoo, MI $1,839
Kalamazoo-Portage metro
Kansas City, MO $2,014
Kansas City metro
Kenosha, WI $1,984
Kenosha metro
Kent, WA $2,404
Seattle-Tacoma-Bellevue metro
Killeen, TX $1,588
Killeen-Temple metro
Kirkland, WA $2,404
Seattle-Tacoma-Bellevue metro
Knoxville, TN $1,729
Knoxville metro
Lafayette, LA $1,747
Lafayette metro
Lakeland, FL $1,670
Lakeland-Winter Haven metro
Lakeville, MN $2,093
Minneapolis-St. Paul-Bloomington metro
Lakewood, CO $1,799
Denver-Aurora-Centennial metro
Lansing, MI $2,071
Lansing-East Lansing metro
Las Vegas, NV $1,921
Las Vegas-Henderson-North Las Vegas metro
Lewiston, ME $2,039
Lewiston-Auburn metro
Lewisville, TX $1,734
Dallas-Fort Worth-Arlington metro
Lexington, KY $1,708
Lexington-Fayette metro
Lincoln, NE $1,761
Lincoln metro
Little Rock, AR $1,565
Little Rock-North Little Rock-Conway metro
Livonia, MI $2,095
Detroit-Warren-Dearborn metro
Los Angeles, CA $1,967
Los Angeles-Long Beach-Anaheim metro
Louisville, KY $1,788
Louisville/Jefferson County metro
Lowell, MA $2,062
Boston-Cambridge-Newton metro
Madison, WI $2,039
Madison metro
Manchester, NH $1,814
Manchester-Nashua metro
Mankato, MN $2,112
Mankato metro
Maple Grove, MN $2,093
Minneapolis-St. Paul-Bloomington metro
Marietta, GA $1,729
Atlanta-Sandy Springs-Roswell metro
McKinney, TX $1,734
Dallas-Fort Worth-Arlington metro
Medford, OR $2,258
Medford metro
Memphis, TN $1,764
Memphis metro
Meridian, ID $1,775
Boise City metro
Mesa, AZ $1,769
Phoenix-Mesa-Chandler metro
Miami, FL $1,729
Miami-Fort Lauderdale-West Palm Beach metro
Midland, TX $1,743
Midland metro
Milwaukee, WI $2,029
Milwaukee-Waukesha metro
Minneapolis, MN $2,093
Minneapolis-St. Paul-Bloomington metro
Missoula, MT $2,052
Missoula metro
Mobile, AL $1,777
Mobile metro
Montgomery, AL $1,592
Montgomery metro
Moorhead, MN $2,015
Fargo metro
Murfreesboro, TN $1,802
Nashville-Davidson--Murfreesboro--Franklin metro
Nampa, ID $1,775
Boise City metro
Naperville, IL $2,414
Chicago-Naperville-Elgin metro
Naples, FL $1,750
Naples-Marco Island metro
Nashua, NH $1,814
Manchester-Nashua metro
Nashville, TN $1,802
Nashville-Davidson--Murfreesboro--Franklin metro
New Braunfels, TX $1,703
San Antonio-New Braunfels metro
New Haven, CT $2,023
New Haven metro
New Orleans, LA $1,789
New Orleans-Metairie metro
New York, NY $2,048
New York-Newark-Jersey City metro
Newark, NJ $2,048
New York-Newark-Jersey City metro
Newark, DE $1,979
Philadelphia-Camden-Wilmington metro
Norfolk, VA $1,787
Virginia Beach-Chesapeake-Norfolk metro
Ocala, FL $1,557
Ocala metro
Oceanside, CA $2,003
San Diego-Chula Vista-Carlsbad metro
Ogden, UT $1,782
Ogden metro
Oklahoma City, OK $1,766
Oklahoma City metro
Olathe, KS $2,014
Kansas City metro
Omaha, NE $1,788
Omaha metro
Orlando, FL $1,606
Orlando-Kissimmee-Sanford metro
Overland Park, KS $2,014
Kansas City metro
Pasadena, CA $1,967
Los Angeles-Long Beach-Anaheim metro
Paterson, NJ $2,048
New York-Newark-Jersey City metro
Pearl City, HI $2,381
Urban Honolulu metro
Pearland, TX $1,737
Houston-Pasadena-The Woodlands metro
Pembroke Pines, FL $1,729
Miami-Fort Lauderdale-West Palm Beach metro
Peoria, IL $2,070
Peoria metro
Peoria, AZ $1,769
Phoenix-Mesa-Chandler metro
Philadelphia, PA $1,979
Philadelphia-Camden-Wilmington metro
Phoenix, AZ $1,769
Phoenix-Mesa-Chandler metro
Pittsburgh, PA $1,896
Pittsburgh metro
Plano, TX $1,734
Dallas-Fort Worth-Arlington metro
Plymouth, MN $2,093
Minneapolis-St. Paul-Bloomington metro
Port St. Lucie, FL $1,727
Port St. Lucie metro
Portland, OR $2,457
Portland-Vancouver-Hillsboro metro
Portland, ME $1,933
Portland-South Portland metro
Prior Lake, MN $2,093
Minneapolis-St. Paul-Bloomington metro
Providence, RI $1,969
Providence-Warwick metro
Provo, UT $1,764
Provo-Orem-Lehi metro
Raleigh, NC $1,700
Raleigh-Cary metro
Rapid City, SD $1,768
Rapid City metro
Reno, NV $1,951
Reno metro
Renton, WA $2,404
Seattle-Tacoma-Bellevue metro
Richfield, MN $2,093
Minneapolis-St. Paul-Bloomington metro
Richmond, VA $1,771
Richmond metro
Riverside, CA $1,951
Riverside-San Bernardino-Ontario metro
Roanoke, VA $1,722
Roanoke metro
Rochester, MN $2,058
Rochester metro
Rochester, NY $2,021
Rochester metro
Rockford, IL $2,272
Rockford metro
Roseville, MN $2,093
Minneapolis-St. Paul-Bloomington metro
Roswell, GA $1,729
Atlanta-Sandy Springs-Roswell metro
Round Rock, TX $1,756
Austin-Round Rock-San Marcos metro
Sacramento, CA $1,982
Sacramento-Roseville-Folsom metro
Salem, OR $2,359
Salem metro
Salt Lake City, UT $1,791
Salt Lake City-Murray metro
San Antonio, TX $1,703
San Antonio-New Braunfels metro
San Diego, CA $2,003
San Diego-Chula Vista-Carlsbad metro
San Francisco, CA $2,264
San Francisco-Oakland-Fremont metro
San Jose, CA $2,236
San Jose-Sunnyvale-Santa Clara metro
Sandy Springs, GA $1,729
Atlanta-Sandy Springs-Roswell metro
Santa Clarita, CA $1,967
Los Angeles-Long Beach-Anaheim metro
Santa Fe, NM $1,707
Santa Fe metro
Santa Rosa, CA $2,022
Santa Rosa-Petaluma metro
Sarasota, FL $1,624
North Port-Bradenton-Sarasota metro
Savage, MN $2,093
Minneapolis-St. Paul-Bloomington metro
Savannah, GA $1,725
Savannah metro
Schaumburg, IL $2,414
Chicago-Naperville-Elgin metro
Scottsdale, AZ $1,769
Phoenix-Mesa-Chandler metro
Scranton, PA $1,900
Scranton--Wilkes-Barre metro
Seattle, WA $2,404
Seattle-Tacoma-Bellevue metro
Shakopee, MN $2,093
Minneapolis-St. Paul-Bloomington metro
Shreveport, LA $1,763
Shreveport-Bossier City metro
Silver Spring, MD $1,999
Washington-Arlington-Alexandria metro
Sioux Falls, SD $1,773
Sioux Falls metro
South Burlington, VT $1,857
Burlington-South Burlington metro
Southaven, MS $1,764
Memphis metro
Sparks, NV $1,951
Reno metro
Spokane, WA $2,061
Spokane-Spokane Valley metro
Springfield, IL $2,138
Springfield metro
Springfield, MA $2,023
Springfield metro
Springfield, MO $1,697
Springfield metro
St. Cloud, MN $2,093
St. Cloud metro
St. George, UT $1,695
St. George metro
St. Louis, MO $2,019
St. Louis metro
St. Louis Park, MN $2,093
Minneapolis-St. Paul-Bloomington metro
St. Paul, MN $2,093
Minneapolis-St. Paul-Bloomington metro
St. Petersburg, FL $1,710
Tampa-St. Petersburg-Clearwater metro
Stamford, CT $2,056
Bridgeport-Stamford-Danbury metro
Sterling Heights, MI $2,095
Detroit-Warren-Dearborn metro
Stockton, CA $2,007
Stockton-Lodi metro
Sugar Land, TX $1,737
Houston-Pasadena-The Woodlands metro
Surprise, AZ $1,769
Phoenix-Mesa-Chandler metro
Syracuse, NY $2,018
Syracuse metro
Tacoma, WA $2,404
Seattle-Tacoma-Bellevue metro
Tampa, FL $1,710
Tampa-St. Petersburg-Clearwater metro
Tempe, AZ $1,769
Phoenix-Mesa-Chandler metro
Thornton, CO $1,799
Denver-Aurora-Centennial metro
Toledo, OH $1,981
Toledo metro
Toms River, NJ $2,048
New York-Newark-Jersey City metro
Topeka, KS $1,836
Topeka metro
Torrance, CA $1,967
Los Angeles-Long Beach-Anaheim metro
Troy, MI $2,095
Detroit-Warren-Dearborn metro
Tucson, AZ $1,742
Tucson metro
Tulsa, OK $1,786
Tulsa metro
Tuscaloosa, AL $1,752
Tuscaloosa metro
Vancouver, WA $2,457
Portland-Vancouver-Hillsboro metro
Virginia Beach, VA $1,787
Virginia Beach-Chesapeake-Norfolk metro
Warren, MI $2,095
Detroit-Warren-Dearborn metro
Warwick, RI $1,969
Providence-Warwick metro
Washington, DC $1,999
Washington-Arlington-Alexandria metro
Waterbury, CT $1,998
Waterbury-Shelton metro
West Jordan, UT $1,791
Salt Lake City-Murray metro
Wichita, KS $1,839
Wichita metro
Wilmington, DE $1,979
Philadelphia-Camden-Wilmington metro
Wilmington, NC $1,657
Wilmington metro
Winston-Salem, NC $1,689
Winston-Salem metro
Woodbury, MN $2,093
Minneapolis-St. Paul-Bloomington metro
Worcester, MA $1,993
Worcester metro
Yonkers, NY $2,048
New York-Newark-Jersey City metro
2. Concord, NH and Juneau, AK are not inside a metro area that the BLS reports an electrician wage for, so they use their state nonmetropolitan electrician wage instead of a metro-specific one. That is why they appear in this city list with a value but are not ranked in the 173-metro table or plotted on the map. We did not assign them a metro coordinate.

Two ways a charger install turns into a service job

From the panel side, by Matt Kovalik, licensed Minnesota journeyworker electrician.

The ranking above prices the install at each metro's electrician wage. Whether a house needs more than a charger circuit depends on its electrical service, not its city. Two Census housing indicators, taken metro by metro, show that the same question comes up for opposite reasons in different parts of the country.

What is already known about panel capacity

A national online survey by the Electric Power Research Institute in 2022 (2,949 responses, 1,857 in single-family detached homes) found that over 20 percent of single-family respondents had a main breaker of 100 amps or less; a Berkeley Lab recalculation of the same survey, dropping respondents who could not read their breaker, puts it at 27 percent of single-family detached homes. A UC Davis and Berkeley Lab survey of single-family homeowners across the country, reported at the 2024 ACEEE Summer Study from 281 validated responses, found 62.5 percent of homes with panels of 200 amps or more and 29.5 percent at 100 amps or less, with 200 amp panels increasing in homes built after the 1960s and 100 amp panels declining after 2000. Pecan Street estimated in 2021 that 35 to 45 million U.S. homes could fully electrify with their existing panels, an extrapolation from 263 homes in its research testbed, 96 percent of them in Texas, mostly in one Austin neighborhood and mostly built after 2007. None of those numbers come from the big public housing surveys. As Berkeley Lab researchers put it in a 2026 paper, the Residential Energy Consumption Survey, the U.S. Census, the American Housing Survey, and California's appliance saturation survey do not include panel capacity, and the estimates that do exist are either national with no state breakdown or state-level with small samples.

So national and single-state estimates of panel capacity exist. A metro-level view does not, because none of the big housing surveys record the panel. What this section adds is the metro level, using two housing-stock indicators that the published work associates with panel capacity: the age of the stock and how it is heated.

What this does not measure. This page does not measure electrical panel capacity, and it is not a substitute for the surveys, metering studies, and permit records cited in this section, which do. It reports two housing-stock indicators, taken metro by metro from the Census, that the published literature associates with panel capacity. They describe places, not houses, and they say nothing about any single home.
Failure mode 1: condition

Older housing stock, gas or oil heat

Buffalo-Cheektowaga: 77 percent of housing units built before 1980, 9 percent of occupied units heated with electricity.

This is a condition problem. The electrical load is light, because the furnace, the water heater, and often the range and dryer burn gas. On paper a 100 amp service usually has room for a Level 2 charger. What it may not have is a service worth adding to: a fuse panel, a known problem brand such as Federal Pacific or Zinsco, a service entrance cable that has been outdoors since the 1970s, or no grounding electrode system or bonding worth the name. The charger is not the reason for the upgrade. It is the reason someone finally looked at the panel.

Failure mode 2: load

Newer housing stock, electric heat

Cape Coral-Fort Myers: 20 percent of housing units built before 1980, 94 percent of occupied units heated with electricity.

This is a load problem. The service is usually 200 amps and the panel is in good shape. But a heat pump with electric backup heat, an electric water heater, an electric range, a dryer, and a pool pump already put a heavy calculated load on it before a charger is counted. The Code figures a 48 amp charger at 60 amps because it is a continuous load. Nothing is wrong with the house. It is already using a good share of what it has.

Both homeowners hear the same sentence from an estimator: you may need a panel upgrade. The jobs behind that sentence are opposites. One replaces old equipment that has capacity to spare. The other manages or expands capacity on equipment that is in good shape. Which one you are is not visible from a metro statistic. It is visible from your panel and from a load calculation.

On a service call, these two houses do not look anything alike. In an older Buffalo house, you can open the panel and find a fuse box or a rusted service entrance feeding a home that has relatively few major electrical loads. In Cape Coral, you might find a clean 200A panel already carrying strip heat, a heat pump, and an electric water heater. The address changes the labor market, but the condition and existing load of the electrical system are what determine what the job actually looks like.

What each one means at the panel

For the older house, the first question is whether the existing service can be kept. Article 220.87 of the National Electrical Code lets an electrician establish the existing load from a year of utility demand data, or from a 30 day recording, instead of a worst case calculation. On a gas heated house that measured number is often low, and 125 percent of it plus the charger fits under 100 amps with room left. Metering backs that up. In the Massachusetts residential baseline study, reported at the 2024 ACEEE Summer Study, homes with 200 amp panels averaged a one minute peak of about 65 amps, and about 5 percent reached or exceeded 100 amps; homes with 100 amp panels averaged about 50 amps (71 and 105 metered homes). In that sample, measured demand ran far below the rating. That gap is the premise behind 220.87 and the reason an upgrade is not automatic. When it fits, the upgrade conversation is about the condition of the panel and the service entrance, and a sound 100 amp service can take a 40 amp charger circuit without being replaced. When the panel is a known problem brand, a fuse box, or corroded, the charger waits until the service is replaced, and that is a separate job with its own price.

A load calculation under 220.87 is not just looking at the number stamped on the main breaker. It means looking at the existing service, measuring or documenting the actual load, and determining whether the proposed equipment can be supported by the service as it stands. What I have seen is that the calculation often does not get run. It is faster to look at a 100A panel and quote a 200A service than to work through the numbers, and on a bid visit nobody is paying for that time. The problem is that the homeowner can end up paying for a service upgrade that the load may not require.

For the newer house, the question is arithmetic. Article 220.83 gives the calculation for adding load to an existing dwelling, and on an all electric house the big lines are the ones the Sunbelt is full of: strip heat in the air handler, an electric water heater and sometimes a tankless one, a range, a dryer, a pool pump, and often a pool heater. Whether a 60 amp charger circuit fits under 200 amps depends on the house, and on a 150 amp service, which many 1980s and 1990s houses have, it frequently does not. The fixes are usually cheaper than a new service: a 32 amp charger on a 40 amp circuit instead of a 48 amp unit on a 60, a charger with an energy management setting that caps its draw, with the setting locked or access restricted, so only the capped value counts against the service (NEC 625.42), or a metered demand study under 220.87 that shows the house never pulls what the calculation assumes.

In both cases some homeowners avoid a panel or service upgrade entirely. The older house with a sound 100 amp service and a light load gets a 40 amp circuit and a charger. The newer house gets a smaller or load managed charger and keeps its 200 amp service. The mistake is deciding which case you are from the age of the house or the size of the panel before anyone has done a load calculation and opened the cover. A quote that skips that step is a guess, in either direction.

Every metro on both indicators

All 173 metros from the cost ranking above, plotted on the two indicators. The dashed lines are the medians across the 173: 45.5 percent of housing units built before 1980, and 34.8 percent of occupied units heated with electricity. Hover a dot for its values. The two single condition groups hold 61 and 61 metros, which is arithmetic, not a finding: a median split of two negatively correlated variables produces near equal off diagonal groups by construction. This chart is plain SVG and needs no JavaScript; every value is also in the housing data CSV below it.

Housing age and electric heat, 173 metrosEach dot is one metro. Dashed lines are the medians across the 173 metros.Ringed dots are the 13 metro core; the two larger ringed dots are Buffalo and Cape Coral.0%20%40%60%80%0%20%40%60%80%100%median 45.5%median 34.8%Newer stock, electric heatBoth conditions presentNeither conditionOlder stock, gas or oil heatShare of housing units built before 1980 (all units)Share of occupied units heated with electricityPortland-Vancouver-Hillsboro, OR-WA: 46% of housing units built before 1980, 51% of occupied units heated with electricityChicago-Naperville-Elgin, IL-IN: 63% of housing units built before 1980, 15% of occupied units heated with electricitySeattle-Tacoma-Bellevue, WA: 43% of housing units built before 1980, 55% of occupied units heated with electricityBend, OR: 26% of housing units built before 1980, 49% of occupied units heated with electricitySalem, OR: 49% of housing units built before 1980, 52% of occupied units heated with electricityFairbanks-College, AK: about 38% of housing units built before 1980, about 11% of occupied units heated with electricityRockford, IL: 61% of housing units built before 1980, 12% of occupied units heated with electricitySan Francisco-Oakland-Fremont, CA: 67% of housing units built before 1980, 31% of occupied units heated with electricityMedford, OR: 45% of housing units built before 1980, 54% of occupied units heated with electricitySan Jose-Sunnyvale-Santa Clara, CA: 59% of housing units built before 1980, 36% of occupied units heated with electricitySpringfield, IL: 61% of housing units built before 1980, 21% of occupied units heated with electricityMankato, MN: 52% of housing units built before 1980, 19% of occupied units heated with electricityDuluth, MN-WI: 68% of housing units built before 1980, 19% of occupied units heated with electricityAnchorage, AK: 36% of housing units built before 1980, 14% of occupied units heated with electricityDetroit-Warren-Dearborn, MI: 66% of housing units built before 1980, 12% of occupied units heated with electricityMinneapolis-St. Paul-Bloomington, MN-WI: 49% of housing units built before 1980, 19% of occupied units heated with electricitySt. Cloud, MN: 44% of housing units built before 1980, 27% of occupied units heated with electricityAnn Arbor, MI: 53% of housing units built before 1980, 19% of occupied units heated with electricityBillings, MT: 48% of housing units built before 1980, 22% of occupied units heated with electricityLansing-East Lansing, MI: 60% of housing units built before 1980, 18% of occupied units heated with electricityPeoria, IL: 71% of housing units built before 1980, 23% of occupied units heated with electricityBoston-Cambridge-Newton, MA-NH: 66% of housing units built before 1980, 19% of occupied units heated with electricityRochester, MN: 45% of housing units built before 1980, 16% of occupied units heated with electricityBridgeport-Stamford-Danbury, CT: 67% of housing units built before 1980, 20% of occupied units heated with electricityEvansville, IN: 58% of housing units built before 1980, 38% of occupied units heated with electricityMissoula, MT: 45% of housing units built before 1980, 34% of occupied units heated with electricityNew York-Newark-Jersey City, NY-NJ: 73% of housing units built before 1980, 15% of occupied units heated with electricityLewiston-Auburn, ME: about 64% of housing units built before 1980, about 9% of occupied units heated with electricityMadison, WI: 46% of housing units built before 1980, 23% of occupied units heated with electricityMilwaukee-Waukesha, WI: 67% of housing units built before 1980, 19% of occupied units heated with electricityHartford-West Hartford-East Hartford, CT: 67% of housing units built before 1980, 16% of occupied units heated with electricityNew Haven, CT: 70% of housing units built before 1980, 18% of occupied units heated with electricitySpringfield, MA: 76% of housing units built before 1980, 21% of occupied units heated with electricitySanta Rosa-Petaluma, CA: 52% of housing units built before 1980, 26% of occupied units heated with electricityAkron, OH: 65% of housing units built before 1980, 16% of occupied units heated with electricityRochester, NY: 67% of housing units built before 1980, 19% of occupied units heated with electricityGreen Bay, WI: 49% of housing units built before 1980, 19% of occupied units heated with electricitySt. Louis, MO-IL: 58% of housing units built before 1980, 33% of occupied units heated with electricitySyracuse, NY: 68% of housing units built before 1980, 19% of occupied units heated with electricityGreat Falls, MT: 66% of housing units built before 1980, 16% of occupied units heated with electricityDavenport-Moline-Rock Island, IA-IL: 71% of housing units built before 1980, 18% of occupied units heated with electricityFargo, ND-MN: 38% of housing units built before 1980, 45% of occupied units heated with electricityKansas City, MO-KS: 51% of housing units built before 1980, 29% of occupied units heated with electricityStockton-Lodi, CA: 44% of housing units built before 1980, 29% of occupied units heated with electricitySan Diego-Chula Vista-Carlsbad, CA: 50% of housing units built before 1980, 35% of occupied units heated with electricityWashington-Arlington-Alexandria, DC-VA-MD-WV: 45% of housing units built before 1980, 45% of occupied units heated with electricityBakersfield-Delano, CA: 43% of housing units built before 1980, 31% of occupied units heated with electricityWaterbury-Shelton, CT: 66% of housing units built before 1980, 21% of occupied units heated with electricityWorcester, MA: 64% of housing units built before 1980, 20% of occupied units heated with electricityKenosha, WI: 56% of housing units built before 1980, 20% of occupied units heated with electricityAlbany-Schenectady-Troy, NY: 62% of housing units built before 1980, 19% of occupied units heated with electricitySacramento-Roseville-Folsom, CA: 44% of housing units built before 1980, 34% of occupied units heated with electricityToledo, OH: 68% of housing units built before 1980, 21% of occupied units heated with electricityCheyenne, WY: 50% of housing units built before 1980, 21% of occupied units heated with electricityPhiladelphia-Camden-Wilmington, PA-NJ-DE-MD: 67% of housing units built before 1980, 25% of occupied units heated with electricityProvidence-Warwick, RI-MA: 70% of housing units built before 1980, 13% of occupied units heated with electricityLos Angeles-Long Beach-Anaheim, CA: 67% of housing units built before 1980, 29% of occupied units heated with electricityReno, NV: 34% of housing units built before 1980, 30% of occupied units heated with electricityRiverside-San Bernardino-Ontario, CA: 36% of housing units built before 1980, 22% of occupied units heated with electricityChattanooga, TN-GA: 46% of housing units built before 1980, 70% of occupied units heated with electricityHarrisburg-Carlisle, PA: 57% of housing units built before 1980, 37% of occupied units heated with electricityFresno, CA: 46% of housing units built before 1980, 35% of occupied units heated with electricityPortland-South Portland, ME: 53% of housing units built before 1980, 13% of occupied units heated with electricityFort Wayne, IN: 55% of housing units built before 1980, 25% of occupied units heated with electricityLas Vegas-Henderson-North Las Vegas, NV: 18% of housing units built before 1980, 36% of occupied units heated with electricityCleveland, OH: 72% of housing units built before 1980, 17% of occupied units heated with electricityGrand Forks, ND-MN: 53% of housing units built before 1980, 39% of occupied units heated with electricityCasper, WY: 55% of housing units built before 1980, 21% of occupied units heated with electricityScranton--Wilkes-Barre, PA: 74% of housing units built before 1980, 22% of occupied units heated with electricityPittsburgh, PA: 73% of housing units built before 1980, 17% of occupied units heated with electricityBurlington-South Burlington, VT: 49% of housing units built before 1980, 14% of occupied units heated with electricityAppleton, WI: 49% of housing units built before 1980, 15% of occupied units heated with electricityAllentown-Bethlehem-Easton, PA-NJ: 62% of housing units built before 1980, 33% of occupied units heated with electricityKalamazoo-Portage, MI: 58% of housing units built before 1980, 19% of occupied units heated with electricityWichita, KS: 53% of housing units built before 1980, 29% of occupied units heated with electricityTopeka, KS: 61% of housing units built before 1980, 23% of occupied units heated with electricityIdaho Falls, ID: 45% of housing units built before 1980, 35% of occupied units heated with electricityBaton Rouge, LA: 35% of housing units built before 1980, 66% of occupied units heated with electricityIndianapolis-Carmel-Greenwood, IN: 47% of housing units built before 1980, 38% of occupied units heated with electricityColumbus, OH: 48% of housing units built before 1980, 29% of occupied units heated with electricityBoulder, CO: 42% of housing units built before 1980, 25% of occupied units heated with electricityManchester-Nashua, NH: 53% of housing units built before 1980, 12% of occupied units heated with electricityBangor, ME: 54% of housing units built before 1980, 13% of occupied units heated with electricityNashville-Davidson--Murfreesboro--Franklin, TN: 32% of housing units built before 1980, 63% of occupied units heated with electricityDenver-Aurora-Centennial, CO: 41% of housing units built before 1980, 29% of occupied units heated with electricityDes Moines-West Des Moines, IA: 46% of housing units built before 1980, 30% of occupied units heated with electricitySalt Lake City-Murray, UT: 42% of housing units built before 1980, 16% of occupied units heated with electricityGulfport-Biloxi, MS: 37% of housing units built before 1980, 80% of occupied units heated with electricityOmaha, NE-IA: 51% of housing units built before 1980, 25% of occupied units heated with electricityVirginia Beach-Chesapeake-Norfolk, VA-NC: 44% of housing units built before 1980, 58% of occupied units heated with electricityTulsa, OK: 48% of housing units built before 1980, 36% of occupied units heated with electricityGrand Rapids-Wyoming-Kentwood, MI: 51% of housing units built before 1980, 10% of occupied units heated with electricityOgden, UT: 38% of housing units built before 1980, 13% of occupied units heated with electricityBismarck, ND: 44% of housing units built before 1980, 24% of occupied units heated with electricityDayton-Kettering-Beavercreek, OH: 69% of housing units built before 1980, 31% of occupied units heated with electricityBoise City, ID: 29% of housing units built before 1980, 30% of occupied units heated with electricityColumbia, MO: 37% of housing units built before 1980, 43% of occupied units heated with electricitySioux Falls, SD-MN: 39% of housing units built before 1980, 28% of occupied units heated with electricityFort Collins-Loveland, CO: 32% of housing units built before 1980, 25% of occupied units heated with electricityRichmond, VA: 44% of housing units built before 1980, 65% of occupied units heated with electricityFlagstaff, AZ: 28% of housing units built before 1980, 26% of occupied units heated with electricityPhoenix-Mesa-Chandler, AZ: 27% of housing units built before 1980, 68% of occupied units heated with electricityRapid City, SD: 45% of housing units built before 1980, 32% of occupied units heated with electricityOklahoma City, OK: 45% of housing units built before 1980, 39% of occupied units heated with electricityMemphis, TN-MS-AR: 46% of housing units built before 1980, 49% of occupied units heated with electricityProvo-Orem-Lehi, UT: 25% of housing units built before 1980, 17% of occupied units heated with electricityDover, DE: 35% of housing units built before 1980, 34% of occupied units heated with electricityLincoln, NE: 48% of housing units built before 1980, 35% of occupied units heated with electricityAustin-Round Rock-San Marcos, TX: 19% of housing units built before 1980, 57% of occupied units heated with electricityColumbia, SC: 35% of housing units built before 1980, 72% of occupied units heated with electricityGreenville-Anderson-Greer, SC: 37% of housing units built before 1980, 59% of occupied units heated with electricityTuscaloosa, AL: 37% of housing units built before 1980, 70% of occupied units heated with electricityNaples-Marco Island, FL: 17% of housing units built before 1980, 91% of occupied units heated with electricityLafayette, LA: 40% of housing units built before 1980, 77% of occupied units heated with electricityMidland, TX: 33% of housing units built before 1980, 52% of occupied units heated with electricityTucson, AZ: 39% of housing units built before 1980, 45% of occupied units heated with electricityCorpus Christi, TX: 44% of housing units built before 1980, 79% of occupied units heated with electricityColorado Springs, CO: 36% of housing units built before 1980, 24% of occupied units heated with electricityDurham-Chapel Hill, NC: 31% of housing units built before 1980, 59% of occupied units heated with electricityHouston-Pasadena-The Woodlands, TX: 31% of housing units built before 1980, 53% of occupied units heated with electricityAlbuquerque, NM: 41% of housing units built before 1980, 18% of occupied units heated with electricityCharlotte-Concord-Gastonia, NC-SC: 29% of housing units built before 1980, 54% of occupied units heated with electricityCharleston-North Charleston, SC: 28% of housing units built before 1980, 76% of occupied units heated with electricityDallas-Fort Worth-Arlington, TX: 30% of housing units built before 1980, 62% of occupied units heated with electricityClarksville, TN-KY: 31% of housing units built before 1980, 71% of occupied units heated with electricityAtlanta-Sandy Springs-Roswell, GA: 26% of housing units built before 1980, 43% of occupied units heated with electricityKnoxville, TN: 43% of housing units built before 1980, 65% of occupied units heated with electricityMiami-Fort Lauderdale-West Palm Beach, FL: 45% of housing units built before 1980, 91% of occupied units heated with electricityPort St. Lucie, FL: 24% of housing units built before 1980, 93% of occupied units heated with electricityHuntsville, AL: 31% of housing units built before 1980, 75% of occupied units heated with electricitySavannah, GA: 35% of housing units built before 1980, 76% of occupied units heated with electricityJacksonville, FL: 32% of housing units built before 1980, 93% of occupied units heated with electricityFayetteville, NC: 36% of housing units built before 1980, 78% of occupied units heated with electricityTampa-St. Petersburg-Clearwater, FL: 39% of housing units built before 1980, 91% of occupied units heated with electricityLexington-Fayette, KY: 42% of housing units built before 1980, 59% of occupied units heated with electricitySanta Fe, NM: 34% of housing units built before 1980, 18% of occupied units heated with electricitySan Antonio-New Braunfels, TX: 33% of housing units built before 1980, 72% of occupied units heated with electricityRaleigh-Cary, NC: 19% of housing units built before 1980, 59% of occupied units heated with electricityBirmingham, AL: 46% of housing units built before 1980, 56% of occupied units heated with electricitySpringfield, MO: 41% of housing units built before 1980, 42% of occupied units heated with electricitySt. George, UT: about 11% of housing units built before 1980, about 38% of occupied units heated with electricityWinston-Salem, NC: 44% of housing units built before 1980, 68% of occupied units heated with electricityGainesville, FL: 33% of housing units built before 1980, 81% of occupied units heated with electricityLakeland-Winter Haven, FL: 30% of housing units built before 1980, 93% of occupied units heated with electricityAsheville, NC: 36% of housing units built before 1980, 63% of occupied units heated with electricityWilmington, NC: 23% of housing units built before 1980, 88% of occupied units heated with electricityFort Smith, AR-OK: 44% of housing units built before 1980, 55% of occupied units heated with electricityJackson, MS: 43% of housing units built before 1980, 50% of occupied units heated with electricityNorth Port-Bradenton-Sarasota, FL: 35% of housing units built before 1980, 90% of occupied units heated with electricityOrlando-Kissimmee-Sanford, FL: 24% of housing units built before 1980, 91% of occupied units heated with electricityCedar Rapids, IA: 55% of housing units built before 1980, 19% of occupied units heated with electricityMontgomery, AL: 44% of housing units built before 1980, 58% of occupied units heated with electricityAthens-Clarke County, GA: 35% of housing units built before 1980, 70% of occupied units heated with electricityKilleen-Temple, TX: 30% of housing units built before 1980, 83% of occupied units heated with electricityFayetteville-Springdale-Rogers, AR: 22% of housing units built before 1980, 46% of occupied units heated with electricityLittle Rock-North Little Rock-Conway, AR: 38% of housing units built before 1980, 54% of occupied units heated with electricityEl Paso, TX: 39% of housing units built before 1980, 26% of occupied units heated with electricityOcala, FL: 24% of housing units built before 1980, 87% of occupied units heated with electricityBuffalo-Cheektowaga, NY: 77% of housing units built before 1980, 9% of occupied units heated with electricityCape Coral-Fort Myers, FL: 20% of housing units built before 1980, 94% of occupied units heated with electricityUrban Honolulu, HI: 57% of housing units built before 1980, 48% of occupied units heated with electricityEugene-Springfield, OR: 55% of housing units built before 1980, 75% of occupied units heated with electricitySpokane-Spokane Valley, WA: 52% of housing units built before 1980, 45% of occupied units heated with electricityBaltimore-Columbia-Towson, MD: 56% of housing units built before 1980, 42% of occupied units heated with electricityCharleston, WV: 68% of housing units built before 1980, 44% of occupied units heated with electricityHuntington-Ashland, WV-KY-OH: 56% of housing units built before 1980, 51% of occupied units heated with electricityCincinnati, OH-KY-IN: 56% of housing units built before 1980, 40% of occupied units heated with electricityNew Orleans-Metairie, LA: 63% of housing units built before 1980, 59% of occupied units heated with electricityLouisville/Jefferson County, KY-IN: 53% of housing units built before 1980, 44% of occupied units heated with electricityMobile, AL: 51% of housing units built before 1980, 63% of occupied units heated with electricityBeaumont-Port Arthur, TX: 49% of housing units built before 1980, 63% of occupied units heated with electricityShreveport-Bossier City, LA: 50% of housing units built before 1980, 56% of occupied units heated with electricityRoanoke, VA: 58% of housing units built before 1980, 54% of occupied units heated with electricityBuffaloCape CoralNew YorkEugeneHonoluluNew OrleansProvoFairbanksSt. GeorgeSource: NailThePrice.com, from U.S. Census ACS 5-year 2020-2024
Older stock, gas or oil heat (61) Newer stock, electric heat (61) Both conditions present (25) Neither condition (26) Stress-tested core (13)
Download the housing data for all 173 metros (CSV)

Where both conditions are present

25 metros sit above both medians. 13 of them stay there under every stress test we ran: a pre-1990 cutoff in place of pre-1980, an electric heat threshold set anywhere from 30 to 40 percent instead of the median, and a check that each metro's estimate clears the median by more than its 90 percent margin of error on both axes. Ten of those 13 form a Gulf and Appalachian belt, from Beaumont and New Orleans through Mobile, Shreveport, Louisville, Cincinnati, Huntington, Charleston, Roanoke, and Baltimore; the other three are Pacific metros: Eugene, Spokane, and Honolulu.

Both conditions are present in these places. That is a statement about the housing stock of a metro, not a ranking of how hard an install is, and it does not say that any particular house there is both old and electrically heated. The two indicators come from different universes and cannot be combined into a share of homes.

The belt's Gulf and Appalachian concentration is why we mention a related finding from California, which this page cannot test: a 2024 UCLA analysis of statewide parcel and permit records estimated that the share of single-family homes with the smallest panels, under 100 amps, was roughly four times higher in disadvantaged communities than elsewhere, 8 percent against 2 percent. This page measures neither panels nor income, so we note the parallel and do not extend it.

MetroStateBuilt before 1980Electric heatInstall cost rank (of 173)
Charleston, WVWV68%44%85
New Orleans-Metairie, LALA63%59%96
Roanoke, VAVA58%54%146
Urban Honolulu, HIHI57%48%4
Huntington-Ashland, WV-KY-OHWV56%51%89
Cincinnati, OH-KY-INOH56%40%90
Baltimore-Columbia-Towson, MDMD56%42%80
Eugene-Springfield, OROR55%75%8
Louisville/Jefferson County, KY-INKY53%44%98
Spokane-Spokane Valley, WAWA52%45%25
Mobile, ALAL51%63%106
Shreveport-Bossier City, LALA50%56%119
Beaumont-Port Arthur, TXTX49%63%111

None of this tells you whether your house needs a panel upgrade. The service size, condition of the equipment, existing loads, available capacity, and what you are planning to add are all house-level facts that a metro-wide cost study cannot see. A Cincinnati address is not a diagnosis. The load calculation and an inspection of the actual service are what settle the question.

How to read these two numbers

Why the spread tracks regional electrician wages

The service job section explains why two quotes for the same house can diverge. The spread between metros is a different matter, and it is a wage story from end to end. The highest electrician medians in the May 2025 BLS data sit in the Pacific Northwest: the Portland, Bend, Salem, and Eugene metros in Oregon all rank in the top eight for install cost, alongside Seattle. The lowest medians cluster across the South: Ocala and Orlando in Florida, El Paso in Texas, and Little Rock and Fayetteville in Arkansas sit at the bottom of the table. A high-wage metro and a low-wage metro can differ by more than twenty dollars an hour in the electrician median, and that gap is what moves the install estimate.

We report this as a wage observation and stop there. The figures show where electrician wages are high and where they are low, and the install ranking tracks that pattern by construction. We do not assert a single cause for why one region pays electricians more than another, because that would go beyond what the wage data alone supports.

Methodology and sources

Keep reading

Frequently asked questions

How much does a home EV charger installation cost in 2026?
At the national median electrician wage, a home Level 2 EV charger installation costs about $1,800 in 2026. Across the 173 metros in this study the estimate ranges from roughly $1,560 to about $2,460. These are modeled figures for the install labor plus national equipment and materials. A permit and any panel upgrade are separate, and local quotes will vary with the specifics of your home.
Why does a home EV charger cost more in some cities than others?
Almost all of the difference is local electrician labor. The charger unit, the wiring, and the materials are priced nationally, so they do not move much from city to city. Electrician wages do. This study holds materials at their national cost and varies only the labor portion by the local electrician wage, which is why a higher-wage metro shows a higher install estimate than a lower-wage one.
Which metros are the most and least expensive for an EV charger install?
The most expensive metro in this study is Portland-Vancouver-Hillsboro, OR-WA at about $2,460, and the Oregon metros of Bend, Salem, and Eugene also rank near the top with Seattle. The least expensive is Ocala, FL at roughly $1,560, with El Paso, Little Rock, and several other Southern metros close behind. The ranking follows local electrician wages.
Is there still a federal tax credit for a home EV charger?
No. The federal tax credit expired June 30, 2026. While it was in effect it covered 30 percent of a residential charger installation up to $1,000 under Internal Revenue Code Section 30C, so an install completed on or after July 1 gets no federal credit. Some states and electric utilities still offer their own rebates, so it is worth checking local programs before you commit.
How much does a panel upgrade add to an EV charger install?
A panel upgrade is a common add-on and a major cost driver. If the panel is in poor condition or cannot take the added load, a service or panel upgrade often adds $1,000 or more on top of the charger install. As a standalone job, our own panel upgrade cost data puts the national average at about $2,200. Whether you need one depends on two different things: the condition of the existing panel and service entrance, and whether the charger fits under the service rating in a load calculation. A licensed electrician checks both during an estimate, and some homes need neither.
How was this EV charger cost estimate calculated?
We start from the national install figure, split it into labor and materials, hold the materials national, and scale the labor by each metro's electrician wage from BLS OEWS (SOC 47-2111, May 2025). The formula is install equals $810 in materials plus $990 in labor times the local wage divided by the national median of $30.38 per hour. Figures are modeled from wages, not survey-measured local prices.
Does my house need a panel upgrade for an EV charger?
Not necessarily, and the age of the house does not settle it. An older house with gas heat often has a light electrical load and a 100 amp service with room for a charger circuit; if it needs work, it is usually because the panel or service entrance is in poor condition, not because it is out of capacity. A newer all electric house usually has a sound 200 amp service but a heavy calculated load, so the question is whether the charger fits on paper. The only way to know which case you are is a load calculation and a look inside the panel, which a licensed electrician does as part of an estimate.
What is a load calculation for an EV charger?
A load calculation is the National Electrical Code method, in Article 220, for adding up the electrical demand of a house and comparing it with the service rating. It counts the heating and cooling equipment, water heater, range, dryer, and general circuits with demand factors, then adds the charger as a continuous load, so a 48 amp charger is figured at 60 amps. For an existing house, Article 220.87 also allows the existing load to be taken from a year of utility demand data or a 30 day recording, which is often far below the worst case number. If the total fits under the service rating, no upgrade is required for capacity.
Can load management avoid a panel upgrade for an EV charger?
Often, yes. The Code allows an energy management system to limit what the charger can draw, and only the limited value counts against the service (NEC 625.42). Many chargers have this setting built in, and some monitor the whole panel and throttle the charger when other loads are running. Choosing a 32 amp charger on a 40 amp circuit instead of a 48 amp unit on a 60 amp circuit does the same job with less demand. The trade is slower charging, but 32 amps at 240 volts is about 7.7 kilowatts, which adds roughly 160 to 220 miles of range in eight hours on most EVs after charging losses, well above a typical day of driving. Load management does not fix a panel that is in poor condition; it only addresses capacity.

About this study

Published: June 24, 2026

Updated: August 25, 2026

Wage source: BLS OEWS, SOC 47-2111 Electricians, May 2025.

Housing source: U.S. Census Bureau ACS 5-year 2020-2024, tables B25034 and B25040, pulled 2026-08-25. Metro-level indicators only; this page does not measure panel capacity.

Coverage: 173 metros ranked, 289 cities listed, 2 state nonmetro fallbacks noted.

These are modeled estimates, not measured local prices. Always get quotes from licensed contractors before budgeting.