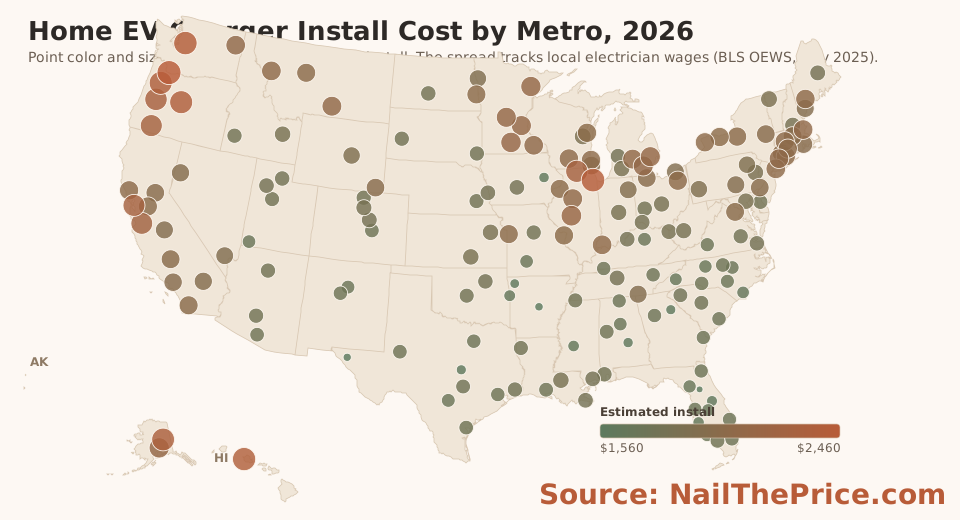
Find your city: the estimated install for all 289 cities in the study
The federal tax credit that offsets part of a home EV charger installation expired on June 30, 2026. A home charger installed now gets no federal credit, so the dollar figures on this page are full retail estimates with no incentive subtracted.1
Part One
What the labor costs
The $1,800 headline is the estimated install at the national median electrician wage, which is $30.38 per hour for electricians in the May 2025 BLS data. It is the right single number to anchor on. For reference, the simple average across the 289 cities in this study works out to about $1,920, which sits above the $1,800 figure only because the studied cities skew toward higher-wage metros. That $1,920 is a study average, not a national average, and it should not be read as one.
We estimated every metro the same way: hold the equipment and materials at their national cost, then flex only the labor portion by the local electrician wage reported by the U.S. Bureau of Labor Statistics. Because labor is the only input that moves from place to place, the cost ranking simply follows the wage ranking, metro by metro. That is the whole story of the wage spread, and the map, the ranked chart, and the full table below show it.
Take Minneapolis as a worked example. The metro electrician median is $39.37 per hour, about 30 percent above the national median, so the estimate comes to about $2,090. That places Minneapolis 40th of the 289 cities in this study, which is 18th of the 173 ranked metros once cities in the same metro are combined.
Part Two explains why two quotes for the same house can diverge. The spread between metros is a different matter, and it is a wage story from end to end. The highest electrician medians in the May 2025 BLS data sit in the Pacific Northwest: the Portland, Bend, Salem, and Eugene metros in Oregon all rank in the top eight for install cost, alongside Seattle. The lowest medians cluster across the South: Ocala and Orlando in Florida, El Paso in Texas, and Little Rock and Fayetteville in Arkansas sit at the bottom of the table. A high-wage metro and a low-wage metro can differ by more than twenty dollars an hour in the electrician median, and that gap is what moves the install estimate.
We report this as a wage observation and stop there. The figures show where electrician wages are high and where they are low, and the install ranking tracks that pattern by construction. We do not assert a single cause for why one region pays electricians more than another, because that would go beyond what the wage data alone supports.
Each point is one metro at its Census centroid, colored and sized by the estimated Level 2 install. Sage is lower cost, terracotta is higher. With JavaScript on, the map is interactive; with it off, the same map renders below and every value is in the table further down.
Estimated Level 2 install, ranked. Every bar is labeled with its dollar value. This chart is plain SVG and needs no JavaScript.
Rank is out of 173 metros, by estimated install cost. Electrician wage is the metro hourly median for SOC 47-2111 in the BLS OEWS May 2025 data. The three highlighted metros have a documented local electrical permit fee, shown as a separate add-on.
| Rank | Metro | State | Electrician median wage | Est. install |
|---|---|---|---|---|
| 1 | Portland-Vancouver-Hillsboro, OR-WA | OR | $50.53 | $2,457 |
| 2 | Chicago-Naperville-Elgin, IL-IN | IL | $49.21 | $2,414 |
| 3 | Seattle-Tacoma-Bellevue, WA | WA | $48.93 | $2,404 |
| 4 | Urban Honolulu, HI | HI | $48.21 | $2,381 |
| 5 | Bend, OR | OR | $47.69 | $2,364 |
| 6 | Salem, OR | OR | $47.53 | $2,359 |
| 7 | Fairbanks-College, AK | AK | $47.05 | $2,343 |
| 8 | Eugene-Springfield, OR | OR | $45.52 | $2,293 |
| 9 | Rockford, IL | IL | $44.85 | $2,272 |
| 10 | San Francisco-Oakland-Fremont, CA | CA | $44.63 | $2,264 |
| 11 | Medford, OR | OR | $44.43 | $2,258 |
| 12 | San Jose-Sunnyvale-Santa Clara, CA | CA | $43.77 | $2,236 |
| 13 | Springfield, IL | IL | $40.76 | $2,138 |
| 14 | Mankato, MN | MN | $39.96 | $2,112 |
| 15 | Duluth, MN-WI | MN | $39.76 | $2,106 |
| 16 | Anchorage, AK | AK | $39.63 | $2,101 |
| 17 | Detroit-Warren-Dearborn, MI | MI | $39.42 | $2,095 |
| 18 | Minneapolis-St. Paul-Bloomington, MN-WI (permit $35 to $300 extra) | MN | $39.37 | $2,093 |
| 19 | St. Cloud, MN | MN | $39.37 | $2,093 |
| 20 | Ann Arbor, MI | MI | $39.16 | $2,086 |
| 21 | Billings, MT | MT | $38.93 | $2,079 |
| 22 | Lansing-East Lansing, MI | MI | $38.69 | $2,071 |
| 23 | Peoria, IL | IL | $38.68 | $2,070 |
| 24 | Boston-Cambridge-Newton, MA-NH | MA | $38.42 | $2,062 |
| 25 | Spokane-Spokane Valley, WA | WA | $38.38 | $2,061 |
| 26 | Rochester, MN | MN | $38.29 | $2,058 |
| 27 | Bridgeport-Stamford-Danbury, CT | CT | $38.25 | $2,056 |
| 28 | Evansville, IN | IN | $38.10 | $2,052 |
| 29 | Missoula, MT | MT | $38.10 | $2,052 |
| 30 | New York-Newark-Jersey City, NY-NJ | NY | $37.99 | $2,048 |
| 31 | Lewiston-Auburn, ME | ME | $37.71 | $2,039 |
| 32 | Madison, WI | WI | $37.71 | $2,039 |
| 33 | Buffalo-Cheektowaga, NY | NY | $37.47 | $2,031 |
| 34 | Milwaukee-Waukesha, WI | WI | $37.41 | $2,029 |
| 35 | Hartford-West Hartford-East Hartford, CT | CT | $37.34 | $2,027 |
| 36 | New Haven, CT | CT | $37.22 | $2,023 |
| 37 | Springfield, MA | MA | $37.22 | $2,023 |
| 38 | Santa Rosa-Petaluma, CA | CA | $37.20 | $2,022 |
| 39 | Akron, OH | OH | $37.19 | $2,022 |
| 40 | Rochester, NY | NY | $37.17 | $2,021 |
| 41 | Green Bay, WI | WI | $37.15 | $2,021 |
| 42 | St. Louis, MO-IL | MO | $37.10 | $2,019 |
| 43 | Syracuse, NY | NY | $37.07 | $2,018 |
| 44 | Great Falls, MT | MT | $37.00 | $2,016 |
| 45 | Davenport-Moline-Rock Island, IA-IL | IA | $36.99 | $2,015 |
| 46 | Fargo, ND-MN | ND | $36.99 | $2,015 |
| 47 | Kansas City, MO-KS | MO | $36.95 | $2,014 |
| 48 | Stockton-Lodi, CA | CA | $36.74 | $2,007 |
| 49 | San Diego-Chula Vista-Carlsbad, CA | CA | $36.62 | $2,003 |
| 50 | Washington-Arlington-Alexandria, DC-VA-MD-WV | DC | $36.50 | $1,999 |
| 51 | Bakersfield-Delano, CA | CA | $36.47 | $1,998 |
| 52 | Waterbury-Shelton, CT | CT | $36.47 | $1,998 |
| 53 | Worcester, MA | MA | $36.30 | $1,993 |
| 54 | Kenosha, WI | WI | $36.04 | $1,984 |
| 55 | Albany-Schenectady-Troy, NY | NY | $36.01 | $1,983 |
| 56 | Sacramento-Roseville-Folsom, CA | CA | $35.98 | $1,982 |
| 57 | Toledo, OH | OH | $35.92 | $1,981 |
| 58 | Cheyenne, WY | WY | $35.86 | $1,979 |
| 59 | Philadelphia-Camden-Wilmington, PA-NJ-DE-MD | PA | $35.86 | $1,979 |
| 60 | Providence-Warwick, RI-MA | RI | $35.57 | $1,969 |
| 61 | Los Angeles-Long Beach-Anaheim, CA | CA | $35.49 | $1,967 |
| 62 | Reno, NV | NV | $35.00 | $1,951 |
| 63 | Riverside-San Bernardino-Ontario, CA | CA | $35.00 | $1,951 |
| 64 | Chattanooga, TN-GA | TN | $34.77 | $1,943 |
| 65 | Harrisburg-Carlisle, PA | PA | $34.53 | $1,935 |
| 66 | Fresno, CA | CA | $34.48 | $1,934 |
| 67 | Portland-South Portland, ME | ME | $34.45 | $1,933 |
| 68 | Fort Wayne, IN | IN | $34.27 | $1,927 |
| 69 | Las Vegas-Henderson-North Las Vegas, NV | NV | $34.08 | $1,921 |
| 70 | Cleveland, OH | OH | $34.07 | $1,920 |
| 71 | Grand Forks, ND-MN | ND | $33.51 | $1,902 |
| 72 | Casper, WY | WY | $33.48 | $1,901 |
| 73 | Scranton--Wilkes-Barre, PA | PA | $33.44 | $1,900 |
| 74 | Pittsburgh, PA | PA | $33.34 | $1,896 |
| 75 | Burlington-South Burlington, VT | VT | $32.14 | $1,857 |
| 76 | Appleton, WI | WI | $32.13 | $1,857 |
| 77 | Allentown-Bethlehem-Easton, PA-NJ | PA | $31.97 | $1,852 |
| 78 | Kalamazoo-Portage, MI | MI | $31.58 | $1,839 |
| 79 | Wichita, KS | KS | $31.57 | $1,839 |
| 80 | Baltimore-Columbia-Towson, MD | MD | $31.54 | $1,838 |
| 81 | Topeka, KS | KS | $31.50 | $1,836 |
| 82 | Idaho Falls, ID | ID | $31.42 | $1,834 |
| 83 | Baton Rouge, LA | LA | $31.41 | $1,834 |
| 84 | Indianapolis-Carmel-Greenwood, IN | IN | $31.31 | $1,830 |
| 85 | Charleston, WV | WV | $31.17 | $1,826 |
| 86 | Columbus, OH | OH | $31.11 | $1,824 |
| 87 | Boulder, CO | CO | $30.83 | $1,815 |
| 88 | Manchester-Nashua, NH | NH | $30.81 | $1,814 |
| 89 | Huntington-Ashland, WV-KY-OH | WV | $30.59 | $1,807 |
| 90 | Cincinnati, OH-KY-IN | OH | $30.53 | $1,805 |
| 91 | Bangor, ME | ME | $30.48 | $1,803 |
| 92 | Nashville-Davidson--Murfreesboro--Franklin, TN | TN | $30.45 | $1,802 |
| 93 | Denver-Aurora-Centennial, CO | CO | $30.36 | $1,799 |
| 94 | Des Moines-West Des Moines, IA | IA | $30.21 | $1,794 |
| 95 | Salt Lake City-Murray, UT | UT | $30.11 | $1,791 |
| 96 | New Orleans-Metairie, LA | LA | $30.04 | $1,789 |
| 97 | Gulfport-Biloxi, MS | MS | $30.02 | $1,788 |
| 98 | Louisville/Jefferson County, KY-IN | KY | $30.02 | $1,788 |
| 99 | Omaha, NE-IA | NE | $30.02 | $1,788 |
| 100 | Virginia Beach-Chesapeake-Norfolk, VA-NC | VA | $29.98 | $1,787 |
| 101 | Tulsa, OK | OK | $29.94 | $1,786 |
| 102 | Grand Rapids-Wyoming-Kentwood, MI | MI | $29.92 | $1,785 |
| 103 | Ogden, UT | UT | $29.82 | $1,782 |
| 104 | Bismarck, ND | ND | $29.76 | $1,780 |
| 105 | Dayton-Kettering-Beavercreek, OH | OH | $29.75 | $1,779 |
| 106 | Mobile, AL | AL | $29.68 | $1,777 |
| 107 | Boise City, ID | ID | $29.62 | $1,775 |
| 108 | Columbia, MO | MO | $29.57 | $1,774 |
| 109 | Sioux Falls, SD-MN | SD | $29.55 | $1,773 |
| 110 | Fort Collins-Loveland, CO | CO | $29.52 | $1,772 |
| 111 | Beaumont-Port Arthur, TX | TX | $29.51 | $1,772 |
| 112 | Richmond, VA | VA | $29.50 | $1,771 |
| 113 | Flagstaff, AZ | AZ | $29.49 | $1,771 |
| 114 | Phoenix-Mesa-Chandler, AZ (permit $195 to $500 extra) | AZ | $29.43 | $1,769 |
| 115 | Rapid City, SD | SD | $29.40 | $1,768 |
| 116 | Oklahoma City, OK | OK | $29.33 | $1,766 |
| 117 | Memphis, TN-MS-AR | TN | $29.27 | $1,764 |
| 118 | Provo-Orem-Lehi, UT | UT | $29.26 | $1,764 |
| 119 | Shreveport-Bossier City, LA | LA | $29.25 | $1,763 |
| 120 | Dover, DE | DE | $29.21 | $1,762 |
| 121 | Lincoln, NE | NE | $29.17 | $1,761 |
| 122 | Austin-Round Rock-San Marcos, TX | TX | $29.03 | $1,756 |
| 123 | Columbia, SC | SC | $29.03 | $1,756 |
| 124 | Greenville-Anderson-Greer, SC | SC | $28.95 | $1,753 |
| 125 | Tuscaloosa, AL | AL | $28.90 | $1,752 |
| 126 | Naples-Marco Island, FL | FL | $28.86 | $1,750 |
| 127 | Lafayette, LA | LA | $28.76 | $1,747 |
| 128 | Midland, TX | TX | $28.62 | $1,743 |
| 129 | Tucson, AZ | AZ | $28.60 | $1,742 |
| 130 | Corpus Christi, TX | TX | $28.56 | $1,741 |
| 131 | Colorado Springs, CO | CO | $28.47 | $1,738 |
| 132 | Durham-Chapel Hill, NC | NC | $28.47 | $1,738 |
| 133 | Houston-Pasadena-The Woodlands, TX | TX | $28.45 | $1,737 |
| 134 | Albuquerque, NM | NM | $28.43 | $1,736 |
| 135 | Charlotte-Concord-Gastonia, NC-SC | NC | $28.41 | $1,736 |
| 136 | Charleston-North Charleston, SC | SC | $28.37 | $1,734 |
| 137 | Dallas-Fort Worth-Arlington, TX | TX | $28.37 | $1,734 |
| 138 | Clarksville, TN-KY | TN | $28.21 | $1,729 |
| 139 | Atlanta-Sandy Springs-Roswell, GA (permit $175 to $500 extra) | GA | $28.20 | $1,729 |
| 140 | Knoxville, TN | TN | $28.19 | $1,729 |
| 141 | Miami-Fort Lauderdale-West Palm Beach, FL | FL | $28.19 | $1,729 |
| 142 | Port St. Lucie, FL | FL | $28.14 | $1,727 |
| 143 | Huntsville, AL | AL | $28.13 | $1,727 |
| 144 | Savannah, GA | GA | $28.09 | $1,725 |
| 145 | Jacksonville, FL | FL | $28.02 | $1,723 |
| 146 | Roanoke, VA | VA | $27.98 | $1,722 |
| 147 | Cape Coral-Fort Myers, FL | FL | $27.85 | $1,718 |
| 148 | Fayetteville, NC | NC | $27.74 | $1,714 |
| 149 | Tampa-St. Petersburg-Clearwater, FL | FL | $27.62 | $1,710 |
| 150 | Lexington-Fayette, KY | KY | $27.56 | $1,708 |
| 151 | Santa Fe, NM | NM | $27.52 | $1,707 |
| 152 | San Antonio-New Braunfels, TX | TX | $27.41 | $1,703 |
| 153 | Raleigh-Cary, NC | NC | $27.31 | $1,700 |
| 154 | Birmingham, AL | AL | $27.23 | $1,697 |
| 155 | Springfield, MO | MO | $27.21 | $1,697 |
| 156 | St. George, UT | UT | $27.17 | $1,695 |
| 157 | Winston-Salem, NC | NC | $26.97 | $1,689 |
| 158 | Gainesville, FL | FL | $26.77 | $1,682 |
| 159 | Lakeland-Winter Haven, FL | FL | $26.40 | $1,670 |
| 160 | Asheville, NC | NC | $26.25 | $1,665 |
| 161 | Wilmington, NC | NC | $26.00 | $1,657 |
| 162 | Fort Smith, AR-OK | AR | $25.24 | $1,632 |
| 163 | Jackson, MS | MS | $25.15 | $1,630 |
| 164 | North Port-Bradenton-Sarasota, FL | FL | $24.97 | $1,624 |
| 165 | Orlando-Kissimmee-Sanford, FL | FL | $24.43 | $1,606 |
| 166 | Cedar Rapids, IA | IA | $24.15 | $1,597 |
| 167 | Montgomery, AL | AL | $23.99 | $1,592 |
| 168 | Athens-Clarke County, GA | GA | $23.92 | $1,589 |
| 169 | Killeen-Temple, TX | TX | $23.88 | $1,588 |
| 170 | Fayetteville-Springdale-Rogers, AR | AR | $23.67 | $1,581 |
| 171 | Little Rock-North Little Rock-Conway, AR | AR | $23.17 | $1,565 |
| 172 | El Paso, TX | TX | $23.14 | $1,564 |
| 173 | Ocala, FL | FL | $22.93 | $1,557 |
Part Two
What the house needs
The ranking prices the labor in each metro, but it says nothing about whether your electrical service can take the charger.
A Level 2 charger does not cost more in Portland because the charger is different from the one installed in Florida. The hardware is basically the same everywhere. The wire, breaker, conduit, fittings, and the charger unit are priced nationally. What changes from city to city is the licensed electrician labor it takes to install them, which is exactly what this study isolates.
That is also why a real quote can land far from the baseline. A charger mounted next to an existing panel with open capacity is a simple job. A long wire run across a finished basement, a detached garage, or a service panel that cannot accept another 240V continuous load, or one in poor enough condition that it should not be added to, is a different job, and the price reflects it. None of that is geography. It is the condition of your electrical system once the panel is opened.
This study does not try to price every panel upgrade or awkward garage layout, because those depend on the house, not the city. It holds the equipment and materials at their national cost and flexes only the labor, so the number you see is the local wage baseline before any house-specific work is added. Treat it as the floor to compare against, then expect a long run, or panel or service work when the load calculation or the panel's condition calls for it, to push a real quote higher. The section on service jobs further down explains which is which.
Whether a house needs more than a charger circuit depends on its electrical service, not its city. Two Census housing indicators, taken metro by metro, show that the same question comes up for opposite reasons in different parts of the country.
A national online survey by the Electric Power Research Institute in 2022 (2,949 responses, 1,857 in single-family detached homes) found that over 20 percent of single-family respondents had a main breaker of 100 amps or less; a Berkeley Lab recalculation of the same survey, dropping respondents who could not read their breaker, puts it at 27 percent of single-family detached homes. A UC Davis and Berkeley Lab survey of single-family homeowners across the country, reported at the 2024 ACEEE Summer Study from 281 validated responses, found 62.5 percent of homes with panels of 200 amps or more and 29.5 percent at 100 amps or less, with 200 amp panels increasing in homes built after the 1960s and 100 amp panels declining after 2000. Pecan Street estimated in 2021 that 35 to 45 million U.S. homes could fully electrify with their existing panels, an extrapolation from 263 homes in its research testbed, 96 percent of them in Texas, mostly in one Austin neighborhood and mostly built after 2007. None of those numbers come from the big public housing surveys. As Berkeley Lab researchers put it in a 2026 paper, the Residential Energy Consumption Survey, the U.S. Census, the American Housing Survey, and California's appliance saturation survey do not include panel capacity, and the estimates that do exist are either national with no state breakdown or state-level with small samples.
So national and single-state estimates of panel capacity exist. A metro-level view does not, because none of the big housing surveys record the panel. What this section adds is the metro level, using two housing-stock indicators that the published work associates with panel capacity: the age of the stock and how it is heated.
Buffalo-Cheektowaga: 77 percent of housing units built before 1980, 9 percent of occupied units heated with electricity.
This is a condition problem. The electrical load is light, because the furnace, the water heater, and often the range and dryer burn gas. On paper a 100 amp service usually has room for a Level 2 charger. What it may not have is a service worth adding to: a fuse panel, a known problem brand such as Federal Pacific or Zinsco, a service entrance cable that has been outdoors since the 1970s, or no grounding electrode system or bonding worth the name. The charger is not the reason for the upgrade. It is the reason someone finally looked at the panel.
Cape Coral-Fort Myers: 20 percent of housing units built before 1980, 94 percent of occupied units heated with electricity.
This is a load problem. The service is usually 200 amps and the panel is in good shape. But a heat pump with electric backup heat, an electric water heater, an electric range, a dryer, and a pool pump already put a heavy calculated load on it before a charger is counted. The Code figures a 48 amp charger at 60 amps because it is a continuous load. Nothing is wrong with the house. It is already using a good share of what it has.
Both homeowners hear the same sentence from an estimator: you may need a panel upgrade. The jobs behind that sentence are opposites. One replaces old equipment that has capacity to spare. The other manages or expands capacity on equipment that is in good shape. Which one you are is not visible from a metro statistic. It is visible from your panel and from a load calculation.
On a service call, these two houses do not look anything alike. In an older Buffalo house, you can open the panel and find a fuse box or a rusted service entrance feeding a home that has relatively few major electrical loads. In Cape Coral, you might find a clean 200A panel already carrying strip heat, a heat pump, and an electric water heater. The address changes the labor market, but the condition and existing load of the electrical system are what determine what the job actually looks like.
For the older house, the first question is whether the existing service can be kept. Article 220.87 of the National Electrical Code lets an electrician establish the existing load from a year of utility demand data, or from a 30 day recording, instead of a worst case calculation. On a gas heated house that measured number is often low, and 125 percent of it plus the charger fits under 100 amps with room left. Metering backs that up. In the Massachusetts residential baseline study, reported at the 2024 ACEEE Summer Study, homes with 200 amp panels averaged a one minute peak of about 65 amps, and about 5 percent reached or exceeded 100 amps; homes with 100 amp panels averaged about 50 amps (71 and 105 metered homes). In that sample, measured demand ran far below the rating. That gap is the premise behind 220.87 and the reason an upgrade is not automatic. When it fits, the upgrade conversation is about the condition of the panel and the service entrance, and a sound 100 amp service can take a 40 amp charger circuit without being replaced. When the panel is a known problem brand, a fuse box, or corroded, the charger waits until the service is replaced, and that is a separate job with its own price.
A load calculation under 220.87 is not just looking at the number stamped on the main breaker. It means looking at the existing service, measuring or documenting the actual load, and determining whether the proposed equipment can be supported by the service as it stands. What I have seen is that the calculation often does not get run. It is faster to look at a 100A panel and quote a 200A service than to work through the numbers, and on a bid visit nobody is paying for that time. The problem is that the homeowner can end up paying for a service upgrade that the load may not require.
For the newer house, the question is arithmetic. Article 220.83 gives the calculation for adding load to an existing dwelling, and on an all electric house the big lines are the ones the Sunbelt is full of: strip heat in the air handler, an electric water heater and sometimes a tankless one, a range, a dryer, a pool pump, and often a pool heater. Whether a 60 amp charger circuit fits under 200 amps depends on the house, and on a 150 amp service, which many 1980s and 1990s houses have, it frequently does not. The fixes are usually cheaper than a new service: a 32 amp charger on a 40 amp circuit instead of a 48 amp unit on a 60, a charger with an energy management setting that caps its draw, with the setting locked or access restricted, so only the capped value counts against the service (NEC 625.42), or a metered demand study under 220.87 that shows the house never pulls what the calculation assumes.
In both cases some homeowners avoid a panel or service upgrade entirely. The older house with a sound 100 amp service and a light load gets a 40 amp circuit and a charger. The newer house gets a smaller or load managed charger and keeps its 200 amp service. The mistake is deciding which case you are from the age of the house or the size of the panel before anyone has done a load calculation and opened the cover. A quote that skips that step is a guess, in either direction.
All 173 metros from the cost ranking above, plotted on the two indicators. The dashed lines are the medians across the 173: 45.5 percent of housing units built before 1980, and 34.8 percent of occupied units heated with electricity. Hover a dot for its values. The two single condition groups hold 61 and 61 metros, which is arithmetic, not a finding: a median split of two negatively correlated variables produces near equal off diagonal groups by construction. This chart is plain SVG and needs no JavaScript; every value is also in the housing data CSV below it.
25 metros sit above both medians. 13 of them stay there under every stress test we ran: a pre-1990 cutoff in place of pre-1980, an electric heat threshold set anywhere from 30 to 40 percent instead of the median, and a check that each metro's estimate clears the median by more than its 90 percent margin of error on both axes. Ten of those 13 form a Gulf and Appalachian belt, from Beaumont and New Orleans through Mobile, Shreveport, Louisville, Cincinnati, Huntington, Charleston, Roanoke, and Baltimore; the other three are Pacific metros: Eugene, Spokane, and Honolulu.
Both conditions are present in these places. That is a statement about the housing stock of a metro, not a ranking of how hard an install is, and it does not say that any particular house there is both old and electrically heated. The two indicators come from different universes and cannot be combined into a share of homes.
The belt's Gulf and Appalachian concentration is why we mention a related finding from California, which this page cannot test: a 2024 UCLA analysis of statewide parcel and permit records estimated that the share of single-family homes with the smallest panels, under 100 amps, was roughly four times higher in disadvantaged communities than elsewhere, 8 percent against 2 percent. This page measures neither panels nor income, so we note the parallel and do not extend it.
| Metro | State | Built before 1980 | Electric heat | Install cost rank (of 173) |
|---|---|---|---|---|
| Charleston, WV | WV | 68% | 44% | 85 |
| New Orleans-Metairie, LA | LA | 63% | 59% | 96 |
| Roanoke, VA | VA | 58% | 54% | 146 |
| Urban Honolulu, HI | HI | 57% | 48% | 4 |
| Huntington-Ashland, WV-KY-OH | WV | 56% | 51% | 89 |
| Cincinnati, OH-KY-IN | OH | 56% | 40% | 90 |
| Baltimore-Columbia-Towson, MD | MD | 56% | 42% | 80 |
| Eugene-Springfield, OR | OR | 55% | 75% | 8 |
| Louisville/Jefferson County, KY-IN | KY | 53% | 44% | 98 |
| Spokane-Spokane Valley, WA | WA | 52% | 45% | 25 |
| Mobile, AL | AL | 51% | 63% | 106 |
| Shreveport-Bossier City, LA | LA | 50% | 56% | 119 |
| Beaumont-Port Arthur, TX | TX | 49% | 63% | 111 |
None of this tells you whether your house needs a panel upgrade. The service size, condition of the equipment, existing loads, available capacity, and what you are planning to add are all house-level facts that a metro-wide cost study cannot see. A Cincinnati address is not a diagnosis. The load calculation and an inspection of the actual service are what settle the question.
Reference
All 289 cities in the study, alphabetical, with the estimated install for each. 287 are priced from the median electrician wage in their metro; Concord, NH and Juneau, AK use a state nonmetropolitan electrician wage instead (note 2). This list is server-rendered and needs no JavaScript.
Published: June 24, 2026
Updated: September 11, 2026
Wage source: BLS OEWS, SOC 47-2111 Electricians, May 2025.
Housing source: U.S. Census Bureau ACS 5-year 2020-2024, tables B25034 and B25040, pulled 2026-08-25. Metro-level indicators only; this page does not measure panel capacity.
Coverage: 173 metros ranked, 289 cities listed, 2 state nonmetro fallbacks noted.
These are modeled estimates, not measured local prices. Always get quotes from licensed contractors before budgeting.